Observability Jaeger Spring Boot: 7 Easy Steps for Full Tracing
In modern microservices architectures, observability isn’t just a luxury — it’s a necessity. When your applications are distributed across dozens of services, tracing a single request end-to-end becomes crucial for debugging, monitoring, and optimization.
That’s where Jaeger and Spring Boot come together beautifully!
Imagine Bob, who owns a growing online store. Bob needs to ensure that when a customer clicks “Buy,” the entire process — order validation, payment, shipping — is traceable. If something breaks, Bob must quickly find where and why.
This guide will help you build that visibility, just like Bob is doing for his store!
What You’ll Need
- Java 17+
- Spring Boot 3.x
- Docker (for running Jaeger locally)
- Maven or Gradle build tool
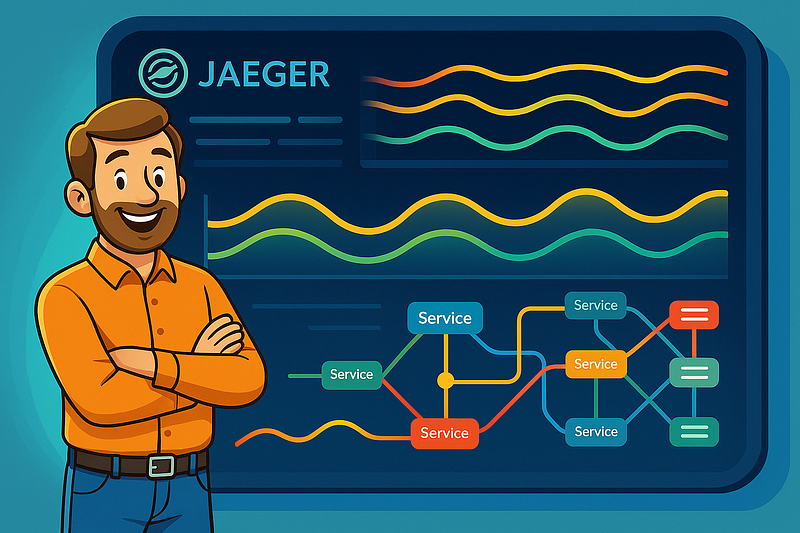
What is Jaeger?

Jaeger is an open-source, end-to-end distributed tracing system developed by Uber. It’s part of the CNCF landscape and helps with:
- Performance / latency optimization
- Root cause analysis
- Service dependency analysis
- Monitoring high-throughput systems
Real-life example with Bob: Imagine Bob sending a package through multiple delivery checkpoints. Without Jaeger, if a package is late, Bob has no idea which checkpoint caused the delay. With Jaeger, Bob can trace the package journey, identify the slow point, and fix the process!
Step-by-Step: Integrating Jaeger with Spring Boot
1. Run Jaeger Locally
First, let’s spin up a Jaeger instance using Docker:
docker run -d --name jaeger \
  -e COLLECTOR_ZIPKIN_HOST_PORT=:9411 \
  -p 5775:5775/udp \
  -p 6831:6831/udp \
  -p 6832:6832/udp \
  -p 5778:5778 \
  -p 16686:16686 \
  -p 14268:14268 \
  -p 14250:14250 \
  -p 9411:9411 \
  jaegertracing/all-in-one:1.50
Access the Jaeger UI at http://localhost:16686
2. Create a Spring Boot Project
Use Spring Initializr with the following settings:
- Dependencies:
- Spring Web
- Spring Boot Actuator
- OpenTelemetry Exporter Jaeger
3. Update Your pom.xml
Add the OpenTelemetry + Jaeger starter:
<dependency>
  <groupId>io.opentelemetry.instrumentation</groupId>
  <artifactId>opentelemetry-spring-boot-starter</artifactId>
  <version>2.1.0</version>
</dependency>
4. Configure application.yml
spring:
  application:
    name: tracing-demo
management:
  tracing:
    sampling:
      probability: 1.0 # 100% sampling
  otlp:
    tracing:
      endpoint: http://localhost:4317
      export:
        protocol: grpc
5. Create a Simple REST Controller
@RestController
@RequestMapping("/api")
public class DemoController {

@GetMapping("/hello")
    public String hello() {
        return "Hello from Spring Boot with Jaeger!";
    }
}
Now, every request hitting /api/hello will generate a full trace visible in Jaeger.
Real-life example with Bob: Bob sets up an endpoint /order/checkout. When a customer places an order, Bob can now trace the complete flow—from the shopping cart to payment—using Jaeger, finding exactly where any delay happens.
Adding Custom Spans
Sometimes you want manual control over your traces. Here’s how:
import io.opentelemetry.api.trace.Span;
import io.opentelemetry.api.trace.Tracer;

@Autowired
private Tracer tracer;
@GetMapping("/manual")
public String manualTrace() {
    Span span = tracer.spanBuilder("custom-span-example").startSpan();
    try {
        // your logic here
        Thread.sleep(200);
    } catch (InterruptedException e) {
        span.recordException(e);
    } finally {
        span.end();
    }
    return "Manual span created!";
}
Real-life example with Bob: Bob adds a manual span around his payment gateway integration. If payment processing takes too long, Bob instantly knows it’s the gateway causing delays.
Real-World Use Cases
- Monitor API latencies across microservices
- Identify bottlenecks in database queries
- Visualize service-to-service calls in real-time
- Improve SLA compliance with proactive alerts
Real-life example with Bob: After setting up Jaeger, Bob notices that the “Inventory Check” service is slower than others. He upgrades that service, improving the entire checkout process for his customers!
Observability

With Jaeger, you get a beautiful visual of your request flow, showing:
- Timeline graphs
- Service dependencies
- Detailed latency breakdowns
Real-life example with Bob: Bob looks at the Jaeger trace graphs like maps of customer journeys. He sees that 90% of customers get stuck at the “Confirm Address” step — so he simplifies that screen, boosting his conversion rates.
Find us
Balian’s Blogs Balian’s
linkedin Shant Khayalian
Facebook Balian’s
X-platform Balian’s
web Balian’s
Youtube Balian’s
#SpringBoot #Jaeger #Observability #Microservices #OpenTelemetry #DevOps #DistributedTracing #JavaDeveloper #Monitoring #APM