


How to Debug Java Applications Like a Pro

Views: 0

Why Debugging Isn’t Just Fixing Bugs
Bob’s Spring Boot app is acting up:
- It’s slow under load
- It hangs randomly
- CPU is spiking without obvious cause
- Memory usage grows over time
Traditional logging won’t cut it. Bob needs to see what the JVM sees.
Let’s level up from “println debugging” to JVM introspection.
Tools of the Trade
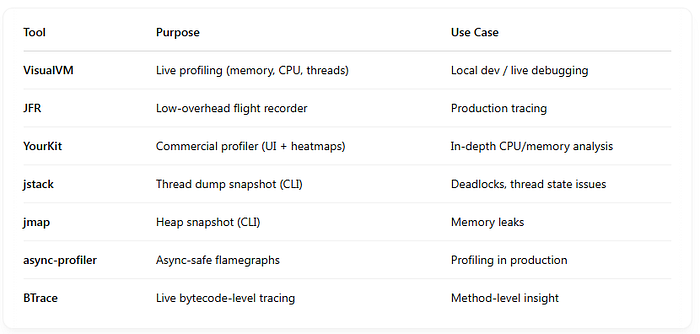
1. Thread Debugging with jstack
Use when:
- Your app hangs
- CPU is high
- You suspect deadlocks or thread leaks
Example:
jstackThen open with tools like:
- FastThread.io
- IntelliJ / VisualVM
- Look for Blocked, Waiting, or RUNNABLE with high CPU
2. Heap Analysis with jmap & VisualVM

Use when:
- OutOfMemoryError
- Memory leaks
- GC isn’t reclaiming memory
Dump heap:
jmap -dump:live,format=b,file=heap.hprofOpen in:
- VisualVM (free)
- Eclipse MAT (Memory Analyzer Tool)
- YourKit (commercial)
Look for:
- Dominator trees
- Retained objects
- Unclosed resources
3. CPU Profiling with Java Flight Recorder (JFR)
Use when:
- CPU is spiking
- Methods are slow
- You need real-time JVM profiling
Record a flight:
jcmdLet it run for a while, then:
jcmdOpen .jfr file in:
- JDKMission Control (JMC)
- View: hot methods, GC, memory, threads
Very low overhead — safe in production!
4. Async Profiler + Flamegraphs
Use when:
- You want visual flamegraphs
- You’re debugging CPU usage or method hotspots
Run with:
./profiler.sh -d 30 -f cpu.svgOpens an interactive flamegraph:
- Wide = time spent
- Tall = stack depth
Perfect for understanding hot code paths and performance bottlenecks.
5. Live Debugging with VisualVM

Best for:
- Quick CPU/memory snapshots
- Watching GC in real time
- Sampling threads
Install VisualVM and attach to your running app:
- View heap usage
- Track thread states
- Take heap/thread dumps
Free, built into most JDKs
Great for dev/staging environments
6. Live Instrumentation with BTrace

Want to trace method arguments and return values in a running app?
Example trace:
@OnMethod( clazz=”com.myapp.Service”, method=”process”, location=@Location(Kind.ENTRY) ) public static void onEnter(@Self Object self, String arg) { println(“Entering with arg: ” + arg); }Zero restart
Live instrumentation
Perfect for debugging unknown behavior without changing code
Bob’s Debugging Flow
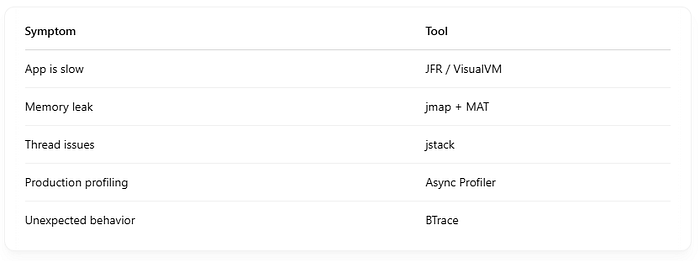
Bob doesn’t guess. He observes, records, and targets the problem like a real JVM detective.
Pro Tips
- Combine JFR + async-profiler for full insight
- Always run with
-XX:+HeapDumpOnOutOfMemoryErrorin prod - Use sampling instead of tracing in production
- Avoid
-agentlib:hprof(deprecated & heavy)
Debugging like a pro means:
- Observing the JVM itself
- Using the right tool for the job
- Visualizing CPU, memory, and threads — not guessing
Bob can now:
- Catch memory leaks
- Profile hotspots
- Reduce latency
- Untangle thread issues
Find us
linkedin Shant Khayalian
Facebook Balian’s
X-platform Balian’s
web Balian’s
Youtube Balian’s
#javadebugging #springboot #jvmprofiling #memoryleak #javaflamegraph #visualvm #jfr #asyncprofiler #threadanalysis #performancetuning